Monday, 7 October 2013

Mapping 2011 Census Data for England and Wales

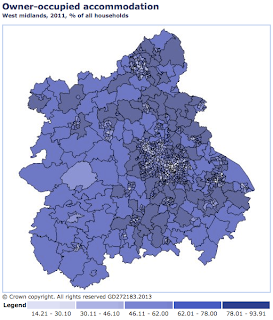
In addition to labour market statistics, Nomis includes detailed data tables for England and Wales from last four censuses. The site has a handy built-in mapping tool. As an example, here's how to create a map of home ownership in West Midlands. (The image is a screenshot using Nomis's medium size option. The maps quality is even better in extra large size.)
  1. Go to the Census data page (also linked to from the Nomis home page).
  2. Choose Key Statistics, then select Tenure from the list.
  3. In the left column, under Explore, click Advanced Query.
  4. In the geography section, choose select areas within, then select 2011 super output areas - mid-layer in the second drop-down list. From the options that appear, choose regions  and West Midlands.
  5. In the tenure section, select only Owned.
  6. In the percent section, tick percent.
  7. In the format/layout section, select Map.
  8. Click download data, then View map.
The Office for National Statistics has a page of Census visualisations. Alex Singleton at the University of Liverpool has created an atlas of Census maps for each local authority area using Nomis downloads and R.

ONS's Census data publishing strategy is here.

No comments:

Post a Comment